
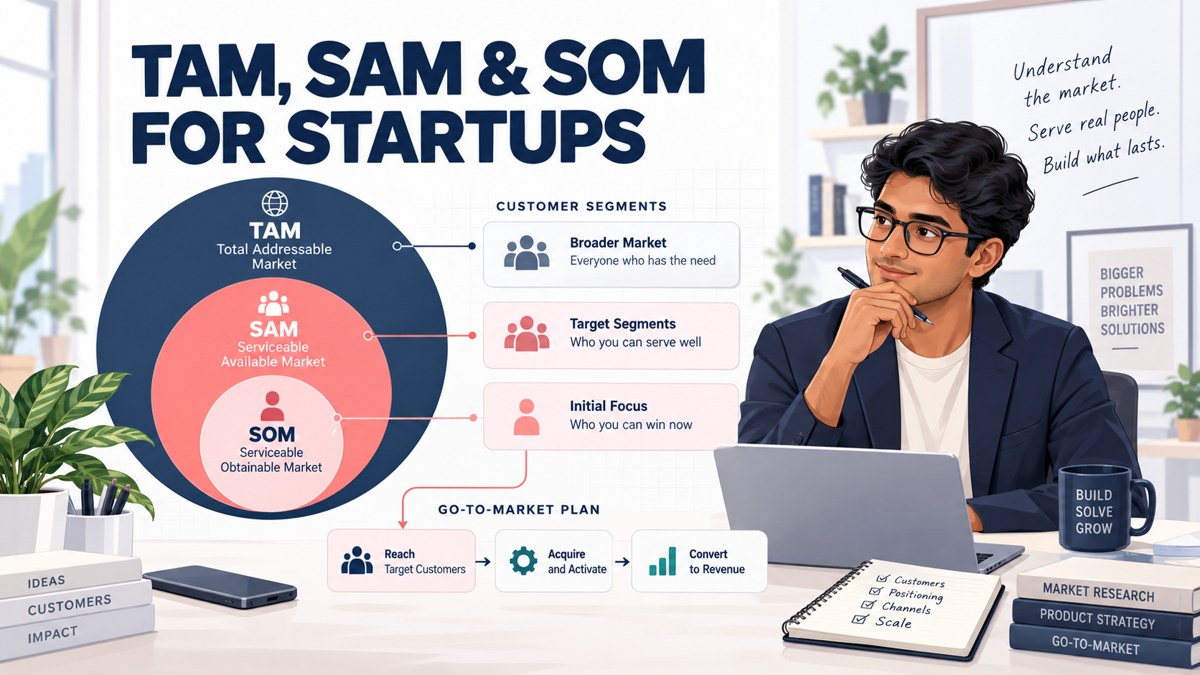
A large industry report does not automatically prove that your startup has a large market. If the report measures all healthcare spending while your product sells scheduling software to small diagnostic centres, most of that figure has nothing to do with your revenue opportunity.
TAM, SAM and SOM help founders move from a broad market to a specific, reachable commercial opportunity. A credible calculation starts with who will pay, how many such customers exist, what they may pay each year and how many the startup can realistically acquire and serve.
Direct answer: calculate TAM as the maximum annual revenue opportunity for the defined product and customer, SAM as the portion your current model can serve, and SOM as the revenue or customers you can realistically capture within a stated period. Use bottom-up assumptions, cite every external source and connect SOM to an operating plan.
What do TAM, SAM and SOM mean?
TAM, SAM and SOM describe three levels of a startup's market opportunity. TAM is the full relevant demand, SAM is the part the startup can serve with its business model, and SOM is the part it can realistically obtain within a defined time and resource plan.
| Term | Full form | Practical meaning | Core question |
|---|---|---|---|
| TAM | Total addressable market | Maximum annual revenue if every relevant customer bought the defined product | How large is the complete opportunity? |
| SAM | Serviceable addressable market | Portion of TAM that the current product, geography, pricing and distribution can serve | Which customers can this model actually serve? |
| SOM | Serviceable obtainable market | Realistic share of SAM the startup can win within a stated period | What can this team acquire and support? |
What is TAM?
Total addressable market is the maximum annual revenue opportunity for a clearly defined product if all relevant customers bought it. It is a theoretical ceiling, not a revenue forecast and not the value of the industry surrounding the product.
TAM = total relevant customers × average annual revenue per customer
For a transaction business, use annual transaction volume and the startup's actual revenue rate. For a consumer product, use target buyers, expected purchase frequency and average revenue per order. The unit should match how the company earns money.
Carta's market-size guide also explains TAM through the potential customer base and average annual customer value. Startup India's official pitch-deck guidelines ask founders to be clear about who will buy, how many customers are in the target market and how much they would pay.
What is SAM?
Serviceable addressable market is the portion of TAM that the startup's present or planned product can serve. SAM applies real boundaries such as geography, customer type, product capability, language, regulation, pricing, channel and delivery capacity.
SAM = serviceable customers × average annual revenue per customer
Suppose a platform could theoretically serve every private school in India, but its current curriculum support, language coverage and sales network fit only English-medium schools in selected states. That defined group, not every school in the country, is the relevant SAM.
The boundary should reflect strategy, not convenience. If a founder removes difficult customers only to make the number look tidy, the calculation loses value. State each filter and explain the commercial reason for it.
What is SOM?
Serviceable obtainable market is the portion of SAM the startup can realistically win within a stated period, usually expressed as customers, annual revenue or both. SOM should reflect the startup's acquisition engine, competitive position, team, capital, conversion, retention and capacity.
SOM = realistically obtainable customers × annual revenue per customer, or SOM = SAM × defensible market-share assumption.
The first is usually more useful for an early-stage startup because it forces the founder to model leads, conversion, sales cycles, onboarding and retention. The second can work when reliable market-share benchmarks exist, but "we will capture 1%" is not a reason by itself.
Always give SOM a time period. A 12-month obtainable market is different from a five-year ambition. If the number cannot be connected to a go-to-market plan, it is probably a hope rather than an estimate.
Why do investors care about TAM, SAM and SOM?
Investors use market size to understand whether a business could become large enough for the proposed funding model and whether the founder understands the customer. They are testing both the size of the opportunity and the quality of the thinking behind it.
For founders, the calculation supports practical decisions:
- Which customer segment should be targeted first?
- Is the current pricing high enough to support the business?
- Does the sales model fit the number of available accounts?
- Will geography or regulation restrict expansion?
- Can the product reach the next stage without serving a new segment?
- Is equity funding suitable for the scale and speed of this opportunity?
How should a startup calculate TAM, SAM and SOM?
The strongest method combines bottom-up calculation, external data and primary customer research. Use the following seven-step process.
Step 1: define the paying customer precisely. Start with the person or organisation that pays, not everyone who benefits. "Indian SMEs" is too broad. "D2C beauty brands processing 2,000 to 20,000 monthly orders and using Shopify" is a more testable account definition. Write down the sector, size, geography, operating behaviour, buying trigger and buyer role. If a marketplace has two user groups, identify which side produces revenue.
Step 2: choose one revenue unit and period. Use annual revenue unless the business has a strong reason to use another period, and match the unit to the model: annual contract value for SaaS; buyers × orders per year × revenue per order for consumer commerce; transaction value × take rate for a marketplace; eligible volume × realised revenue rate for lending or insurance distribution; locations, seats or jobs × price and utilisation for a physical service. Do not use GMV as market revenue when the startup earns only a commission.
Step 3: estimate the total relevant customer base. Build a count from sources that match the definition. Indian founders can search the Open Government Data Platform, MoSPI publications and reports, regulator datasets, industry associations, listed-company filings and credible sector studies. For B2B segments, the official Udyam search can help investigate registered MSME units, but it covers only registered MSMEs and that limitation must appear in the methodology.
Step 4: apply the expected annual revenue per customer. Use actual pricing where available. For a pre-revenue startup, test willingness to pay through customer interviews, proposals, paid pilots or pricing experiments. If several packages exist, calculate a weighted average: weighted annual revenue = (share on basic plan × basic price) + (share on premium plan × premium price). Show whether the price includes GST, onboarding, hardware, support or transaction charges.
Step 5: narrow TAM into SAM using real constraints. List each serviceability filter separately: supported states or cities, product compatibility, language, licence requirements, customer budget, delivery radius, channel access, integration availability and segment fit. Calculate the remaining customer count after each filter to produce an auditable bridge: TAM accounts → geographic fit → product fit → commercial fit → SAM accounts. Avoid double-counting.
Step 6: calculate SOM from execution capacity. Work backwards from the acquisition process: qualified accounts reached, meetings booked, proposals sent, conversion rate, sales-cycle timing, onboarding capacity and retention. A simple B2B formula is new customers = qualified opportunities × conversion rate. Then calculate period-end active customers after expected churn or non-renewal.
Step 7: triangulate and document the assumptions. Compare the bottom-up result with a top-down industry view. Large differences are a prompt to investigate definitions, not an invitation to choose the biggest answer. Create an assumption sheet with the variable, value, source, source date, calculation, limitation and owner. The U.S. Small Business Administration's market-research guidance recommends examining demand, market size, location, saturation and pricing.
What is the difference between top-down and bottom-up market sizing?
Top-down sizing starts with a broad external market figure and applies filters. Bottom-up sizing starts with the number of target customers and the revenue each could generate. Founders should usually use bottom-up sizing as the main model and top-down data as a reasonableness check.
| Method | Starting point | Strength | Main risk |
|---|---|---|---|
| Top-down | Published industry total | Fast context and external reference | Broad definitions can overstate the startup's market |
| Bottom-up | Customer count and pricing | Connected to the business model and sales plan | Weak customer counts or pricing assumptions can mislead |
| Value-based | Economic value created for customers | Useful for new categories without an established budget | Willingness to pay may be much lower than value created |
A top-down report may say that a sector is worth thousands of crores. The founder must still remove revenue pools unrelated to the product, unsupported geographies, customer types that cannot buy and channels the startup cannot access.
A bottom-up model is not automatically accurate either. If the base customer list includes inactive entities or assumes every account pays the premium price, the result can be just as inflated.
A practical TAM, SAM and SOM example for an Indian B2B startup
Hypothetical example: A SaaS startup sells inventory software to independent pharmacy chains. All customer counts and prices below are assumptions created only to explain the method.
The founder defines the target account as a pharmacy business with 2 to 20 outlets. Research produces an estimated 24,000 relevant accounts in India, with a planned average subscription of ₹60,000 per account per year.
TAM = 24,000 accounts × ₹60,000 = ₹144 crore in annual revenue
The current product integrates with systems used by 7,500 accounts in eight launch states, which also fit the startup's language, support and sales model.
SAM = 7,500 accounts × ₹60,000 = ₹45 crore in annual revenue
The startup models its first 24 months from sales capacity. Four salespeople can each close an average of three accounts per month after ramp-up. Allowing for ramp time, failed onboarding and churn, management estimates 220 active accounts at the end of year two.
SOM at the end of year two = 220 active accounts × ₹60,000 = ₹1.32 crore ARR
This SOM is about 2.9% of SAM by revenue, but the model did not begin by guessing 2.9%. It arrived there through a customer-acquisition and retention plan. The founder should still test whether four salespeople can generate enough qualified opportunities and whether the onboarding team can support 220 accounts.
How does TAM, SAM and SOM work for a consumer startup?
Hypothetical example: A direct-to-consumer food brand targets a defined group of working professionals and sells through its website and online marketplaces. The figures below are illustrative, not statements about an actual market.
The founder estimates 12 lakh relevant consumers nationally, each placing six orders per year at an average revenue of ₹700 per order.
TAM = 12 lakh consumers × 6 orders × ₹700 = ₹504 crore annually
The launch plan covers four cities with an estimated 2.2 lakh target consumers reachable through the chosen channels.
SAM = 2.2 lakh consumers × 6 orders × ₹700 = ₹92.4 crore annually
The first-year plan expects 8,000 unique buyers, averaging four orders rather than six because the brand is new.
Year-one SOM = 8,000 buyers × 4 orders × ₹700 = ₹2.24 crore annual revenue
The founder must then test the acquisition budget, website conversion, repeat rate, marketplace fees, fulfilment and gross margin. A revenue opportunity is not the same as profitable demand.
How should founders choose market-sizing sources in India?
A credible source matches the metric, population, geography and date required by the model. Assess every source using five questions: what exactly is being counted, which geography and customer segment are covered, what period the data represents, whether the figure is revenue, spending, transaction value, users or establishments, and which customers or transactions are excluded.
Use official or primary sources where possible. Depending on the sector, these may include Data.gov.in, MoSPI, RBI's Database on Indian Economy, sector regulators, ministry dashboards, public-company annual reports and offer documents. Trade associations and paid research can add detail when their methodology is clear.
Primary research is essential when published data does not match the niche. Interview customers, review sales calls, test pricing and analyse pilot conversion. Record sample size and selection. Ten friendly contacts are useful evidence, but they are not a national survey.
Never mix source years without explaining why. If the customer count is from an older census and the price is current, show the adjustment method or present a range.
How should TAM, SAM and SOM appear in a pitch deck?
The market-opportunity slide should show the three numbers, their definitions, the main formula, the source year and the filters between them. The reader should understand the logic in under a minute and be able to find the backup calculation in the data room.
A useful slide structure is:
- One-line customer definition
- TAM, SAM and time-bound SOM in the same revenue unit
- One formula beneath each number
- Two or three key serviceability filters
- Source names and dates in readable text
- A short note linking SOM to sales or distribution capacity
Do not fill the slide with report screenshots or tiny citations. Put the detailed source table and sensitivity analysis in an appendix or supporting file.
The Startup India pitch-deck guidance separates market opportunity from the startup's execution plan. Keep that distinction: TAM explains the full relevant opportunity, while SOM and the go-to-market plan explain what the company expects to pursue.
What market-sizing mistakes weaken a startup pitch?
The most common mistake is using the size of a broad industry as TAM. Other recurring problems include:
- Counting all users as paying customers
- Presenting GMV or customer spending as startup revenue
- Mixing monthly, annual and lifetime values
- Using global TAM for an India-only product without an expansion case
- Defining SAM as "TAM minus competitors" without serviceability filters
- Setting SOM at 1% or 5% because the percentage sounds conservative
- Ignoring sales cycles, channel access, churn and delivery capacity
- Applying filters twice or using overlapping customer segments
- Using an old source without a transparent update method
- Hiding assumptions inside a spreadsheet with no written explanation
- Making TAM match the valuation or funding amount desired
Fix these issues by keeping the customer, revenue unit and period consistent. Show a low, base and high case when inputs are uncertain. The range should come from changed assumptions, not three arbitrary totals.
How can founders test whether the market size is believable?
Run four checks before adding the numbers to a pitch deck.
Customer-list check: can the team name or source a meaningful sample of the accounts included in SAM? If the startup cannot identify prospects, the segment may be too vague.
Revenue check: does the annual revenue per customer match signed pilots, pricing tests, comparable products or customer budgets?
Capacity check: can the planned team acquire, onboard and support the customers in SOM within the stated period?
Reverse-share check: divide SOM by SAM. If the implied share looks surprising, explain why the startup's distribution, product or timing makes it plausible.
Also test sensitivity. If price falls by 20%, conversion takes twice as long or the target database contains 30% fewer eligible accounts, recalculate SOM. This makes the operating risk visible before it becomes an investor question.
A worked TAM, SAM and SOM example for an Indian startup
Every figure below is illustrative and does not describe an actual market, company or forecast.
Assume a founder is building appointment, patient-communication and report-delivery software for independent diagnostic laboratories. The commercial model is a subscription, and pilot discussions support an expected annual contract value of ₹60,000 per laboratory.
Hypothetical TAM: 40,000 laboratories match the broad customer definition. 40,000 × ₹60,000 = ₹240 crore of annual subscription revenue. This is not the value of the diagnostics industry; it is the software revenue pool under the defined product and pricing model.
Hypothetical SAM: the current product supports the workflows used by 6,000 laboratories in the launch states. The rest are excluded for geography, integration, language or operating-model reasons. 6,000 × ₹60,000 = ₹36 crore.
Hypothetical three-year SOM: four productive salespeople by year three, each closing about two customers a month across 10 productive months, plus roughly 40 inbound and channel customers a year. After ramp time, delayed implementation and churn, management plans for 300 active customers. 300 × ₹60,000 = ₹1.8 crore of annualised subscription revenue.
The logic matters more than the arithmetic. The SOM is tied to sales capacity rather than a declared 5% share, and each assumption still needs testing against the laboratory count, price acceptance, funnel conversion and onboarding capacity.
Top-down, bottom-up or value-based sizing?
Build the core calculation from the bottom up and use a top-down estimate as a reasonableness check. Bottom-up sizing connects customers and pricing to the business model, while broad industry reports often include revenue pools the startup will never serve.
| Method | How it works | Best use | Main risk |
|---|---|---|---|
| Top-down | Starts with an industry total, then applies percentages | Context and cross-check | Broad definitions and arbitrary filters |
| Bottom-up | Multiplies eligible units by revenue per unit | The core startup calculation | Weak customer counts or untested pricing |
| Value-based | Estimates economic value created and the share the startup retains | New categories with little market data | Subjective willingness-to-pay assumptions |
A bottom-up model is not automatically credible. "Five lakh potential customers" still needs a source and "₹10,000 per year" still needs price evidence. Bottom-up describes the structure of the calculation, not the quality of its inputs.
For a new category, value-based sizing can guide research. If software saves a customer ₹4 lakh a year and buyers may pay 10% of that value, the implied price is ₹40,000. Cost saved does not automatically become revenue, so buyers must confirm willingness to pay.
Where should Indian founders find market-sizing data?
Combine official secondary data with direct customer research. Public data estimates how many potential units exist; interviews, pilots and pricing tests show whether those units face the problem and will pay.
Use a source hierarchy:
- Primary operating evidence: paid customers, pilots, invoices, proposals, funnel data and product usage
- Official data: ministries, regulators, registries and statistical releases
- Industry sources: credible associations, audited company reports and distributor data
- Commercial reports: useful when methodology and definitions are published
- Search snippets and unsourced articles: leads for further research, not evidence
| Input | Source | Reference date | Confidence | Next test |
|---|---|---|---|---|
| Eligible customer count | Official registry | Month and year | Medium | Remove dormant entities |
| Annual price | Five paid pilots | Month and year | High | Test enterprise tier |
| Compatible-workflow share | Customer interviews | Month and year | Low | Survey 100 accounts |
| Sales conversion | Early pipeline | Quarter | Low | Review after 30 proposals |
Useful starting points include the Open Government Data Platform India and the Reserve Bank of India's Database on Indian Economy. Check each dataset's definition, reference date and coverage: a registry can include dormant entities and a survey can exclude informal businesses.
Keep an assumption register beside the model so nothing goes stale:
How does market size differ from a revenue forecast?
Market size estimates the opportunity outside the company. A revenue forecast estimates what the company expects to sell, month by month, under an operating plan. SOM can inform the forecast, but the two are not interchangeable without detailed timing.
A forecast includes sales ramp, seasonality, start dates, churn, expansion, implementation delays, collections and capacity. If a startup claims a ₹50 crore SOM but forecasts ₹3 crore of year-three revenue, it should explain whether SOM uses a later horizon, a broader product scope or a different definition. Silent mismatches make the whole model harder to trust.
Connecting market size to the fundraising plan
The market case should show that the funding request produces a measurable step toward the obtainable market. Capital should map to product milestones, channel capacity, acquisition and delivery rather than resting on a large TAM.
Using the laboratory example, a ₹1.5 crore raise allocated to integrations, four sales hires, two implementation roles and runway should show:
- Which part of SAM opens after each integration or launch state
- How many qualified opportunities each sales hire is expected to create
- How onboarding capacity grows with implementation staff
- Which funnel and retention assumptions produce 300 active customers
- What evidence will exist before the next financing decision
How to present TAM, SAM and SOM in a pitch deck
Use one clear slide with the market definition, amount, period, method and formula visible, and keep the detailed source table in the appendix.
- One sentence defining the paying customer and product category
- TAM, SAM and SOM in the same currency and annual period
- A short formula below each figure
- The SOM time horizon
- Source names and reference dates in readable footnotes
- One line explaining the first target segment or market-entry wedge
Do not fill the slide with report screenshots, and do not mix current market size with a 2030 forecast without labelling both. Be ready to explain why certain customers were excluded, how pricing was tested and which acquisition constraint sets SOM.
A pre-investor audit checklist
Run through this before the numbers reach a deck or data room:
- Is the paying customer clearly defined?
- Does the market unit match the pricing model?
- Do TAM, SAM and SOM use the same annual revenue basis?
- Are GMV, customer spend and company revenue separated?
- Is each customer-count source named and dated?
- Is the price based on realised or tested willingness to pay?
- Are the filters from TAM to SAM explicit?
- Is SOM tied to a period and to acquisition capacity?
- Does delivery capacity support the SOM?
- Does the financial forecast reconcile with the obtainable market?
- Are uncertain inputs shown as ranges or scenarios?
- Is the slide readable without a spoken explanation?
If several answers are "no", revise the model before redesigning the slide. Presentation quality cannot repair an undefined customer or an unsupported input.
Conclusion
TAM, SAM and SOM should show how a startup moves from a broad opportunity to a reachable commercial plan. Define the paying customer, use the correct revenue unit, build a bottom-up calculation, apply real serviceability limits and connect SOM to acquisition and delivery capacity.
For Indian founders, the quality of sources and assumptions matters more than the size of the headline number. A defensible market estimate will not guarantee investment, but it can show that the founder understands who buys, what they pay and what the company must do to win.
This article is for educational information only. It is not financial, investment, legal, tax, accounting or securities advice. Market-size estimates depend on definitions, data quality and assumptions, and actual results may differ.
Frequently asked questions
What is the difference between TAM, SAM and SOM?
TAM is the maximum annual revenue opportunity from all relevant customers. SAM is the portion the startup can serve with its product, geography, pricing and channels. SOM is the part of SAM the startup can realistically win within a stated period based on acquisition, competition, retention and capacity.
What is the formula for TAM?
For many startups, TAM equals the total number of relevant customers multiplied by average annual revenue per customer. Transaction businesses may use total eligible transaction volume multiplied by the startup's revenue rate. Consumer companies may use target buyers multiplied by purchase frequency and average revenue per order.
Should TAM be global or India-specific?
TAM should match the product and credible expansion plan. An India-focused startup may show an India TAM as the main number. A global TAM can be included when the product can serve those markets and the founder explains timing, localisation, regulation, distribution and competition. Global industry size alone is not an expansion case.
Can a pre-revenue startup calculate SOM?
Yes, but the estimate will rely more on tested assumptions. A pre-revenue founder can use qualified prospect counts, customer interviews, pilot interest, pricing tests, expected conversion, sales capacity and onboarding limits. Present a range and label assumptions instead of describing an early estimate as proven demand.
Is SOM the same as a revenue forecast?
No. SOM estimates the obtainable portion of a defined market, while a revenue forecast models expected company performance by period. They should be consistent, but the forecast may include ramp-up, churn, seasonality, price changes, new products and timing details that a single SOM number does not show.
Can GMV be used to calculate market size?
GMV can describe transaction value for a marketplace, but it should not be presented as the startup's revenue opportunity when the company keeps only a fee or take rate. Show eligible GMV, the expected revenue rate, refunds or cancellations where relevant, and the resulting company revenue.
How often should a startup update TAM, SAM and SOM?
Update the calculation when pricing, customer definition, product scope, geography, regulation, channel strategy or credible source data changes. Also review it before a major fundraising process. Keep dated versions so investors and team members can see why the estimate changed.
Can TAM, SAM and SOM be measured in customers instead of revenue?
Yes, provided the measure is labelled clearly. Revenue is usually the most useful summary for an investor deck, but customer counts make the calculation easier to audit. Showing both often works well, for example "6,000 serviceable accounts representing ₹36 crore in annual subscription revenue".
What if reliable market data is unavailable?
Build the estimate from observable components: map named accounts, use local registries, interview buyers, speak with distributors, analyse competitor pricing and test sales channels. State the limitations and use scenarios rather than one precise number. A modest, auditable range is more useful than a large figure whose source cannot be explained.