
You may have signed up hundreds of users or landed your first 20 customers. If few return for the job your product is meant to do, buying more traffic can hide a problem rather than solve it. Startup customer retention helps you see whether the people you worked to acquire are finding enough value to come back.
The useful question is not simply "What is our retention percentage?" It is "Which customers return, for what action, after how long, and what should we change because of it?"
What is startup customer retention?
Startup customer retention is the share of a defined group of customers who remain customers or repeat a meaningful action over a stated period. For a subscription product, that may mean still paying after three months. For a grocery service, it may mean placing another order within 30 days. The definition must match the buying or usage cycle.
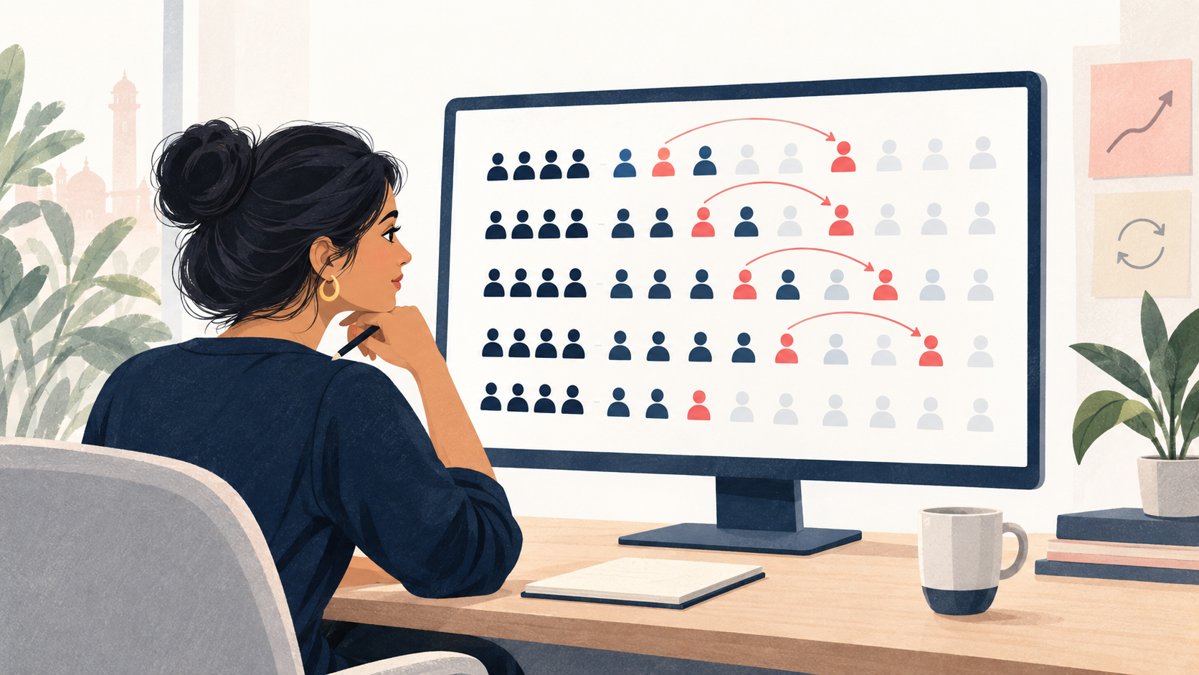
A single overall number can conceal very different stories. A startup may have more active customers this month because it acquired many new ones while most of last month's customers disappeared. Retention asks what happened to the original group. That distinction matters when you are deciding whether to improve the product, change the target customer or increase marketing spend.
It also matters for fundraising. A fast-growing top line tells only part of the story if each new cohort leaves quickly. Investors may ask for the number of paying customers, the proportion who continue, and whether newer customer groups behave better than older ones. Prepare the underlying customer-level evidence, not just a polished graph.
How do you calculate customer retention rate?
For a business with a clear active-customer definition, customer retention rate is the number of customers from the starting group still active at the end of the period divided by the number in that starting group, multiplied by 100. New customers acquired during the period do not belong in the retained numerator.
Customer retention rate = (Starting customers still active at period end ÷ Customers active at period start) × 100.
You can also calculate the numerator as ending customers minus newly acquired customers, provided your customer identity, reactivation and active-status rules are consistent. Count distinct customers rather than transactions, leads or devices. State whether the period is a calendar month, a rolling 30 days or the anniversary of each customer's first purchase.
Hypothetical example: A Bengaluru B2B software startup starts April with 80 paying customer accounts. At the end of April, 65 of those same accounts are still paying. It has also signed 40 new accounts, giving it 105 paying accounts in total. April customer retention for the starting base is 65 ÷ 80 × 100 = 81.25%. Calling 105 ÷ 80 retention would incorrectly treat acquisition as evidence that existing customers stayed.
This formula suits a subscription or a clearly defined active base. It is less informative for a one-off purchase business: someone who bought a bicycle in March may be satisfied without buying another in April. Choose a repeat window that reflects a genuine opportunity to buy again, or measure referrals, service usage and accessory purchases separately.
What should count as a retained customer?
A retained customer should have taken an action that shows continued use of the product's core value within an appropriate time window. A login, email open or app notification tap may show attention, but not necessarily value. Decide on one primary return event before building your chart, and keep secondary engagement measures separate.
For a bookkeeping SaaS product, uploading another month's invoices or completing another reconciliation may be more meaningful than opening the dashboard. For a food subscription, receiving and paying for the next delivery may be the event. A B2B marketplace might distinguish buyers who place a second order from suppliers who fulfil another order; combining both sides into one user metric would blur the question.
Three decisions make a retention definition useful:
- Who enters the group? First-time sign-ups, activated users, first-time buyers and paying accounts are different populations.
- What counts as return? Pick an action tied to delivered value, such as an order, a completed workflow or a paid renewal.
- When should return happen? Set a window that fits normal behaviour: perhaps weekly for a work tool, monthly for invoice software or a longer purchase cycle for a considered consumer product.
Write the definition next to every chart. "42% retained" without a starting population, event and period is too vague to guide a decision.
How does cohort analysis show whether retention is improving?
Cohort analysis groups customers by a shared starting point, usually their first qualifying action or first paid month, then follows each group at the same age. Comparing the first month after acquisition for January customers with the first month for February customers is fairer than comparing all active customers in January and February.
Hypothetical example: A direct-to-consumer essentials startup groups buyers by the month of their first paid order. It measures whether each person places at least one paid order in each subsequent calendar month. The numbers below are invented solely to show the calculation.
| First-order cohort | New buyers | Month 1 repeat | Month 2 repeat | Month 3 repeat |
|---|---|---|---|---|
| January | 120 | 38 (31.7%) | 25 (20.8%) | 21 (17.5%) |
| February | 100 | 40 (40%) | 28 (28%) | Not yet observed |
| March | 90 | 42 (46.7%) | Not yet observed | Not yet observed |
The March cohort appears stronger than January at month 1. That is a reason to investigate, not proof that a new feature caused the improvement. The startup may have changed its acquisition channel, first-order discount, geography, product availability or customer mix. Compare channel and product segments, and check that the definition did not change midway through the table.
Notice that 38 January buyers returned in month 1 and 25 in month 2. Those 25 need not all be a subset of the 38: a buyer can skip one month and return in the next. These cells show activity in each exact month, not a continuously surviving set of customers.
Do not fill a new cohort's unobserved months with zero. If September customers have not yet had a full second month, the month-2 cell is unavailable, not a failure. Very small cohorts should be shown as both counts and percentages; 50% retention based on two customers is fragile evidence.
Which retention metrics matter for different business models?
The useful metric depends on how the company earns money and how often customers naturally need its product. A mobile app can track meaningful product use. A recurring-revenue company should also track whether customers keep paying. A marketplace may need separate measures for buyer repeat orders and seller activity. One number cannot answer all three questions.
| Business model | Primary return signal | Useful companion measure | Watch for |
|---|---|---|---|
| B2B SaaS | Paying accounts renewing or repeating a core workflow | Customer churn and recurring-revenue retention | Many free users but few paying accounts |
| Consumer commerce | Second paid order in a realistic purchase window | Repeat-purchase rate and contribution per repeat order | Discounts creating repeat orders with poor margins |
| Marketplace | Repeat buyer transactions, supply measured separately | Completed orders and fulfilment quality | Gross merchandise value mistaken for platform revenue |
| Service or pilot business | Paid renewal, repeat project or conversion to ongoing contract | Delivery margin and customer concentration | A pilot reported as recurring revenue |
For subscription companies, customer retention counts accounts, while revenue retention follows the recurring revenue from the same starting accounts. Gross revenue retention excludes expansion from existing accounts; net revenue retention includes it. A company can retain most customers but lose substantial revenue if its largest accounts downgrade. Conversely, expansion from a few accounts can mask widespread small-customer churn in net retention.
Hypothetical subscription example: Existing accounts contribute ₹2 lakh in monthly recurring revenue at the start. During the period, those accounts lose ₹30,000 through cancellations and ₹10,000 through downgrades, while other existing accounts add ₹25,000 in upgrades. Gross revenue retention is (₹2,00,000 − ₹30,000 − ₹10,000) ÷ ₹2,00,000 = 80%. Net revenue retention is (₹2,00,000 − ₹30,000 − ₹10,000 + ₹25,000) ÷ ₹2,00,000 = 92.5%. Revenue from newly acquired accounts is excluded from both calculations.
These measures need consistent recurring-revenue rules. Separate one-time setup fees, pass-through charges and unpaid invoices from true subscription revenue. If an annual contract ends in December, the lack of a monthly renewal decision in June should not automatically be treated as a monthly churn event. Show the contract period and accounting basis when presenting the figure.
When is low retention a product problem rather than an acquisition problem?
Low retention may reflect the product, the customer segment, onboarding, service quality, pricing or an unsuitable measurement window. Start with the point at which customers leave and talk to people from that group. A chart can show where a pattern appears; it cannot, on its own, tell you why.
If most users sign up but never complete the first useful task, focus on activation. Watch a few users attempt the task, record where they stop, and simplify the first experience. If many complete the task once but do not return when a new need arises, check whether the problem recurs as often as you assumed. If users keep using the product but paying accounts cancel, interview the person who approves the spend, not only the daily user.
Hypothetical founder decision: A Jaipur invoicing startup sees 300 trial sign-ups in a month. Only 90 send a first invoice, and 54 of those send another invoice the next month. The most immediate leak is not the repeat rate of activated users, which is 54 ÷ 90 = 60%. It is that only 90 ÷ 300 = 30% of sign-ups reached first value. Before buying more leads, the founders could test whether importing a customer list, creating an invoice and inviting an accountant are too difficult. They should also check if those 300 leads were actually in the target segment.
Avoid changing price, onboarding, product and acquisition channel at once. Make a specific hypothesis, choose one intervention and compare later cohorts with similar earlier customers. Record outside changes, such as seasonality or a campaign, so an apparent gain is not credited to the wrong cause.
How should an early-stage startup set up a retention review?
Begin with a simple customer ledger rather than waiting for an expensive analytics stack. Give each person or paying company a stable ID. Record the first qualifying date, acquisition source, customer type, relevant transaction or core-use dates, payments, cancellations and the reason a customer gave for leaving. Protect personal data and restrict access to what the team needs.
Then follow a repeatable monthly process:
- Freeze definitions. Specify the entry event, return event, unit of analysis and exact observation window. Keep a change log if the definition must evolve.
- Reconcile the source. Compare your event log with orders, invoices or the billing system. Remove tests, duplicates and reversed transactions according to a written rule.
- Build aged cohorts. Show the starting count and each fully observed return period. Keep unavailable future periods blank.
- Segment only where useful. Compare paid versus free users, self-serve versus sales-led customers, or two acquisition channels. Avoid tiny segments that create noisy percentages.
- Investigate the largest leak. Speak to a small sample of customers who left and a sample who stayed. Ask about the job they tried to complete and the alternatives they used.
- Decide and retest. Assign one product or commercial change, an owner and a date. Review the next comparable cohort rather than declaring success from a single week.
The team should also watch whether retaining a customer is economically worthwhile. Repeat orders bought through heavy discounts may raise a retention rate while reducing contribution margin. More support calls can improve renewal temporarily but make delivery costly. Pair customer retention with revenue quality, acquisition cost, gross or contribution margin, and cash runway before committing to a larger growth budget.
How can founders show retention to investors without overselling it?
Show the starting customer count, the exact return event, the age of each cohort and the source of the data. Explain customer mix, large-account concentration and changes to pricing or acquisition. A truthful small cohort with clear limitations is more useful than a large-looking number built from downloads or unqualified sign-ups.
An investor-ready slide might show a cohort table for mature months, a line for paying-account retention, and two sentences on what the team learned and changed. Have source records ready to support the chart during diligence. Do not call a new-customer increase retention, omit an inconvenient cohort, or present a pilot's intended contract value as collected recurring revenue.
The interpretation should lead to a decision. If later cohorts improve after fixing onboarding, explain what changed and what remains uncertain. If retention is weak, state the customer segment, the likely reason, the test under way and the milestone that would justify more acquisition spend. This shows discipline without pretending the product is already proven.
What is the practical takeaway for startup customer retention?
Startup customer retention becomes useful when it is tied to the product's actual promise. Define a meaningful return, follow customers from the same starting point, separate existing from new customers, and read the chart alongside payments and customer conversations. The goal is to discover whether repeat demand is improving and where the next rupee of effort should go.
If the evidence is thin, improve the customer experience and measurement first. Stronger repeat behaviour, a credible business model and an honest account of remaining risks make a more persuasive fundraising case than a large acquisition graph on its own.
Frequently asked questions
What is a good customer retention rate for a startup?
There is no single rate that fits every startup. Compare companies only when customer type, paid status, return event and time window are similar. Your most useful baseline is often your own earlier cohort at the same age. Report the counts alongside percentages, investigate why customers leave and watch whether retention improves without excessive discounts or service costs.
What is the difference between retention and churn?
Retention measures how many starting customers remain or return within the defined period. Churn measures how many of that starting group leave under the same definition. In a simple subscription cohort with no special treatment for pauses or reactivations, 80% customer retention implies 20% customer churn for that period. The relationship can be less direct when definitions or time windows differ.
Should a startup measure users or paying customers?
Measure both when both matter, but label them separately. Meaningful product usage can reveal whether users receive value; paying-customer retention reveals whether the buyer continues to pay. In B2B products, several users may belong to one paying company. Use the account as the unit for customer retention and users or seats for product engagement.
Can a startup calculate retention before it has many customers?
Yes, but show counts and avoid claiming statistical certainty. A cohort of ten buyers returning six times is six returning buyers, not strong proof that 60% will return at scale. Track individual reasons for returning or leaving, confirm the event data, and compare later cohorts as the sample grows. Interviews and observed product use add context to a small numerical base.
How often should founders review retention?
Review it at a cadence that matches the natural customer cycle. A daily-use application might examine weekly cohorts; monthly invoicing software may need monthly cohorts; a high-value service contract may require a quarterly or renewal-based view. Check basic data quality more frequently, but avoid declaring a retention change before each cohort has had enough time to return.
Does high retention mean a startup has product-market fit?
High retention is useful evidence that a defined group gets recurring value, but it is not a complete test. Verify that customers pay an appropriate price, that the target market is large enough, that delivery economics work and that the result is not limited to a handful of unusually committed early adopters. Present retention as one part of the case, not as a guarantee of future growth or funding.